

About Me.
My career path has been shaped by a variety of professional experiences that all share a common thread: using information to solve problems and help people make better decisions. Before pursuing my Master of Science in Management Information Systems with a concentration in Business Analytics at the University of Alabama at Birmingham, I worked as an educator, program director, sales associate, and entrepreneur. Each of these roles required interpreting data, identifying patterns, and communicating insights in ways that could guide action.
As a teacher, I used student performance data to adapt instruction and improve learning outcomes, developing the ability to translate complex information into clear and meaningful explanations. Later, as the director of an environmental education center, I led strategic planning, managed budgets, and evaluated program effectiveness using both operational and engagement data. My work as a sales associate and small business owner further strengthened my ability to analyze market trends, customer behavior, and revenue performance to support business decisions.
These experiences ultimately led me to formalize my analytical skillset through graduate study in business analytics. Today, I focus on combining technical data analysis with strong communication and business understanding. I enjoy uncovering insights within data and presenting them in ways that help stakeholders make informed decisions.
What makes my background unique is the intersection of analytics, business perspective, and education. I am comfortable working with data using tools such as SQL, Python, Tableau, and Power BI, but I am equally passionate about telling the story behind the data and helping others understand what it means and how it can guide strategy.
Academic Projects
Here is a sample of academic projects I did while obtaining my Masters in Management Information Systems (Business Analytics) from University of Alabama at Birmingham.
Relational Database & Tableau Dashboard
Tools: Oracle SQL, Tableau
Purpose
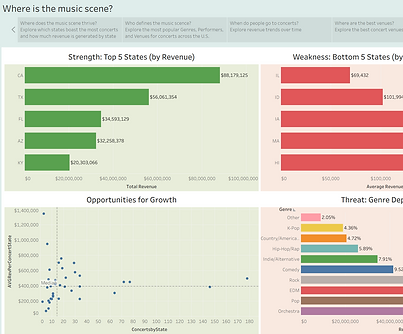
This project was designed to simulate a real-world business analytics scenario in which a consulting team must evaluate performance data for a touring concert company. The goal was to organize operational data into a structured database and analyze patterns in revenue, customer behavior, and geographic performance in order to support strategic decision-making.
Approach
I designed and implemented a normalized relational database in Oracle containing over 1,000 records across multiple tables, including venues, performers, concerts, ticket sales, and customers. Primary and foreign key constraints were established to maintain referential integrity and ensure consistent relationships between datasets.
Using SQL queries with joins, aggregations, and filtering, I analyzed revenue trends across different cities, genres, and performers. The data was then connected to Tableau, where I built interactive dashboards to visualize key performance indicators. These dashboards included revenue heat maps by state, genre performance comparisons, and filterable views that allowed users to drill down into specific concerts or performers.
Outcome
The dashboard allowed stakeholders to quickly identify which locations and music genres generated the highest revenue and which markets showed potential for growth. This simulated the type of analysis that might inform decisions about tour routing, marketing investment, and venue selection.
What I Learned
Through this project, I gained hands-on experience with relational database design, SQL-based data analysis, and translating raw data into visual insights. I also learned how important data structure and organization are when preparing data for business intelligence tools and dashboards.
Predictive Modeling & Customer Segmentation Analysis
Tools: Python, Google Colab
Purpose
The goal of this project was to explore how machine learning techniques can be used to uncover patterns within customer data and support data-driven decision-making. Specifically, the analysis focused on identifying meaningful customer segments and evaluating relationships between variables that influence behavior.
Approach
Using Python within a Google Colab environment, I first performed data cleaning and preprocessing, including handling missing values and applying feature scaling to standardize the dataset. Regression modeling was then used to analyze relationships between key variables and predict outcomes.
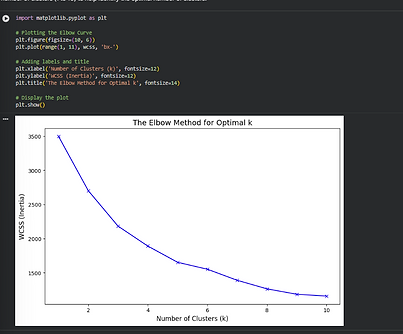
To identify distinct groups within the dataset, I implemented a K-Means clustering model. The Elbow Method was used to determine the optimal number of clusters, allowing the algorithm to group customers based on similarities in their attributes.
Outcome
The clustering analysis revealed several distinct customer segments with different behavioral patterns. These insights demonstrated how organizations can tailor marketing strategies, pricing models, or product offerings to specific groups rather than treating all customers as a single population.
What I Learned
This project strengthened my understanding of the machine learning workflow, from data preparation to model evaluation and interpretation. I also gained experience translating technical model outputs into insights that could be understood by non-technical stakeholders.

Robotic Process Automation Workflow Design
Tools: UiPath
Purpose
This project focused on evaluating how robotic process automation (RPA) can improve efficiency by automating repetitive, rule-based tasks within business workflows. The objective was to identify processes suitable for automation and design an automated workflow that could reliably perform those tasks.
Approach
Using UiPath, I designed an automated workflow that extracted structured data from web-based tables and performed routine data handling tasks. The workflow included selector logic to identify elements on the webpage, browser management configurations to ensure the automation could run reliably, and error-handling mechanisms to account for unexpected changes or interruptions.
In addition to building the workflow, I evaluated the process using RPA suitability frameworks to assess whether the task was stable, rule-based, and scalable enough to benefit from automation.
Outcome
The resulting workflow demonstrated how routine data extraction and processing tasks can be automated, reducing manual effort and improving consistency. This type of automation could allow employees to shift their focus from repetitive tasks toward higher-value analytical or strategic work.
What I Learned
This project helped me understand the broader role of automation in business operations. Beyond building the automation itself, I learned how to evaluate processes for automation potential and consider factors such as return on investment, scalability, and reliability.
Skills
Data Analysis & Technical Skills
SQL • Python • Tableau • Power BI • Oracle Database • Data Visualization • Data Cleaning & Preparation • Relational Database Design • Machine Learning (Regression & Clustering)
Analytics & Business Intelligence
Data Modeling • Dashboard Development • KPI Analysis • Customer Segmentation • Business Process Analysis • Data Storytelling
Professional Strengths
Strategic Thinking • Problem Solving • Cross-Functional Communication • Translating Complex Data into Actionable Insights • Teaching & Presenting Technical Concepts to Diverse Audiences